Slow WordPress Site? Find Out Whether It Is the Server or the Page
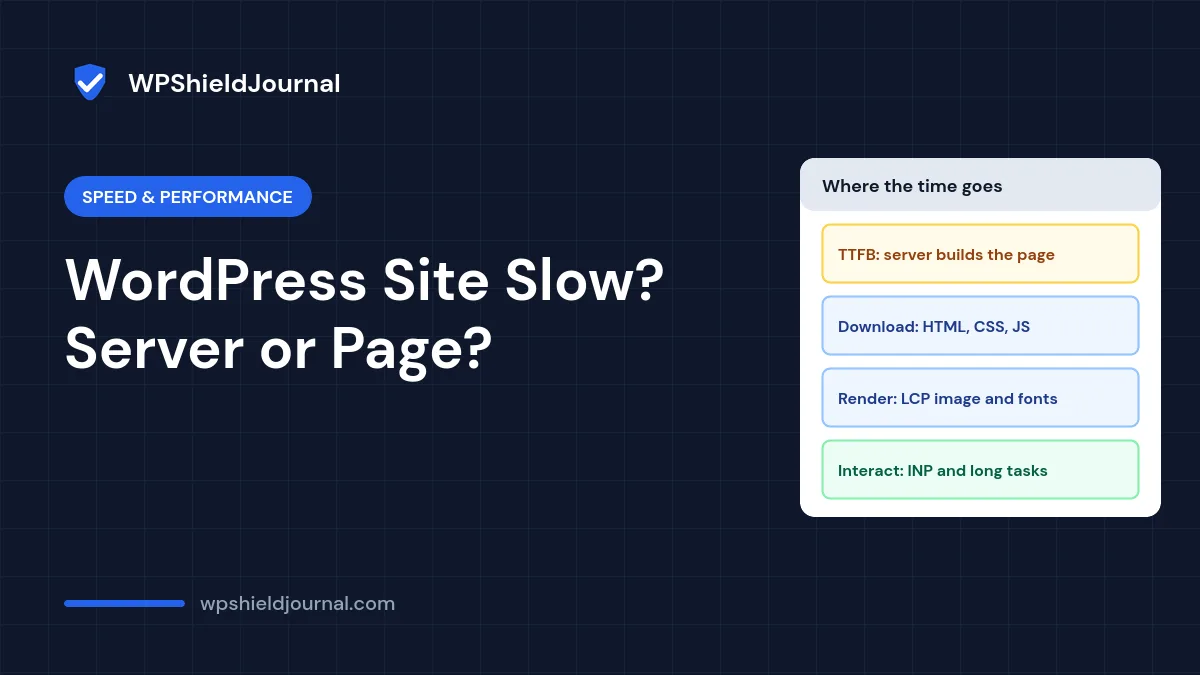
When you have a slow WordPress site, the fix depends on where the time is lost. Either the server takes too long to build the page, or the browser spends too long downloading and drawing it. Optimisation plugins usually attack the second problem even when the first is the real cause. This guide shows how to tell the two apart in a few minutes and what to check for each.
Quick answer: Test the page in a private window and look at Time to First Byte (TTFB). If TTFB is high, the problem is on the server: page caching, slow plugins or database queries, PHP version or hosting resources. If TTFB is low but the page still feels slow, the problem is page weight and rendering: large images, render-blocking CSS and JavaScript, fonts and third-party scripts.
Step 1: Measure your slow WordPress site before changing anything
Write down three numbers for one important page (usually the home page and your most visited article). Measure each page twice, because the first request after a change is often uncached and slower.
- PageSpeed Insights. Enter the URL at PageSpeed Insights. Note both the real-user section (if shown) and the lab result.
- Time to First Byte. In Chrome, open DevTools (F12), go to the Network tab, reload, click the first request (the page itself), and open Timing. “Waiting for server response” is the TTFB.
- Logged in versus logged out. Repeat the test in a private window. Many caching setups do not cache pages for logged-in users, so a slow dashboard session does not always mean visitors see a slow site.
Step 2: Understand what PageSpeed Insights is telling you
According to Google’s PageSpeed Insights documentation, the top section shows field data from the Chrome User Experience Report: real visitors over the previous 28 days, reported at the 75th percentile. The lower section is lab data from Lighthouse, a single simulated test on an emulated mid-range phone. New or low-traffic sites often have no field data at all, which is normal.
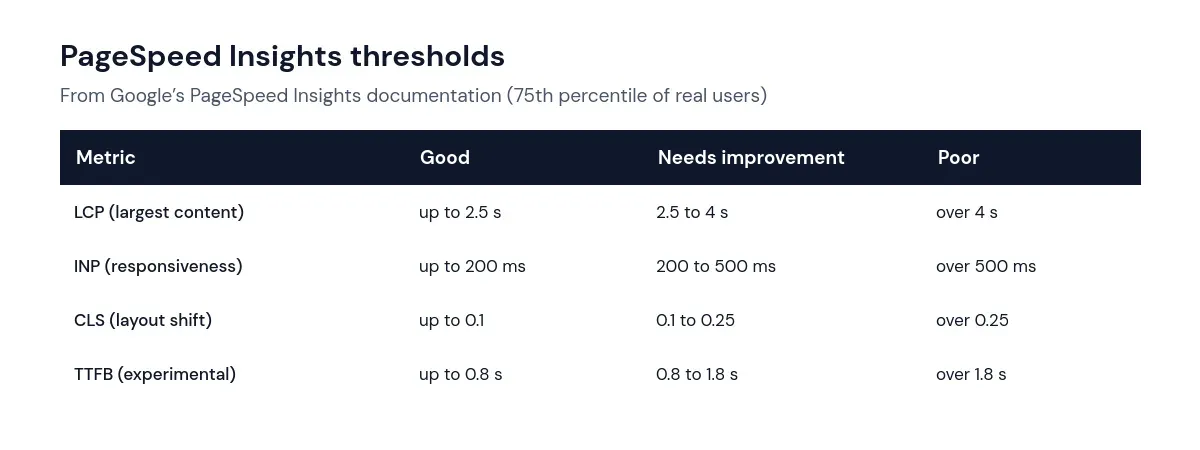
Use the lab score to find problems and the field data to judge whether real visitors are affected. A lab score can change by several points between runs without any change to your site, so do not chase single-point differences.
Step 3: If TTFB is high, the server is slowing your site
A high TTFB means the visitor is waiting before anything starts downloading. On WordPress, the biggest single factor is usually page caching. To show what that means, we measured our own home page from the web server itself:
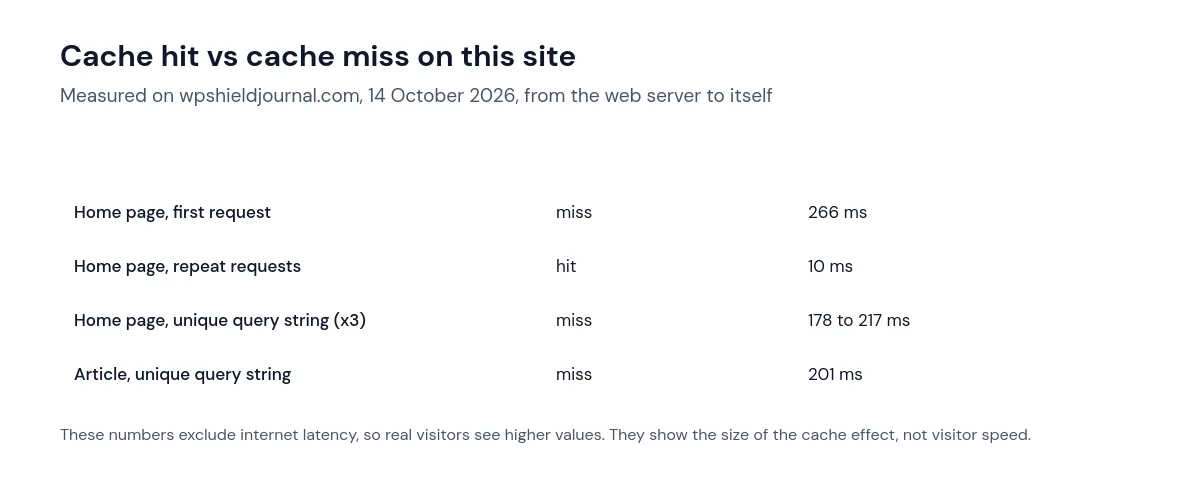
Those figures exclude internet distance, so a real visitor will always see more, but the difference between a cache hit and a cache miss is the point. Check these in order:
- Is page caching working? Look at the response headers in the Network tab. Caching plugins and CDNs usually add a header such as
x-litespeed-cache: hitor a CDN cache status. If every request is a miss, start with our guide to LiteSpeed Cache purge problems or your caching plugin’s documentation. - Slow plugins or database queries. On a staging copy, the free Query Monitor plugin shows slow database queries and which plugin or theme made them. Heavy queries on every request often come from related-posts, statistics or search plugins.
- Large autoloaded options. WordPress loads autoloaded options on every request. Our guide to autoloaded options shows how to find the biggest ones safely.
- Old PHP version. Newer supported PHP versions are generally faster and receive security fixes. Check Tools → Site Health → Info → Server for your version.
- Hosting resources. If uncached pages are slow even with few plugins, or the site slows down at busy times, ask your host whether the account is hitting CPU, memory or process limits. If the host’s logs show heavy admin-ajax.php traffic, see our guide to controlling the WordPress Heartbeat.
- External requests. Plugins that call external services while building the page (fonts, social counters, licence checks) can add seconds when the remote service is slow.
Step 4: If TTFB is low, look at page weight and rendering
When the server responds quickly but the page still loads slowly, the browser is the bottleneck. In PageSpeed Insights, focus on the diagnostics linked to Largest Contentful Paint first:
- The LCP element. PageSpeed Insights shows which element is the largest. It is often a hero or featured image. Make sure it is properly sized, compressed (WebP or AVIF), and not lazy-loaded, because lazy-loading the main above-the-fold image delays it.
- Render-blocking CSS and JavaScript. Every stylesheet and script in the
<head>must load before the page can be drawn. Remove plugins that load assets on every page but are only used on one. - Fonts. Each font weight is a separate file. Use the weights you actually need.
- Third-party scripts. Chat widgets, analytics, ad scripts and embedded videos often outweigh the rest of the page. Check the Network tab sorted by size.
For layout shifts (CLS), make sure images and embeds have width and height set and that banners or cookie notices do not push content down after it loads. For responsiveness (INP), reduce heavy JavaScript, especially from sliders, page builders and third-party widgets.
Step 5: Change one thing, then measure again
Make a single change, clear caches, and repeat the same measurements from Step 1. If you change five things at once and the site breaks or gets slower, you will not know which change caused it. Keep a short log of what you changed and the before and after numbers.
Avoid installing several optimisation plugins at once. Two plugins that both minify or combine CSS and JavaScript commonly break layouts, and two page caches can serve stale pages. Use one caching and optimisation tool and configure it properly.
Frequently asked questions
Why is my site fast for me but a slow WordPress site for visitors?
You may be seeing a cached copy in your browser, or a server close to you. Visitors far from the server, on mobile networks, or arriving on uncached pages see a different picture. Field data in PageSpeed Insights reflects real visitors when there is enough traffic.
Why is the WordPress dashboard slow when the site is fast?
The dashboard is never served from the page cache, so every screen is built from scratch. A slow dashboard points to server-side causes such as slow plugins, database queries, autoloaded options or limited hosting resources.
What is a good TTFB?
PageSpeed Insights treats a TTFB of up to 0.8 seconds as good for real users. Cached WordPress pages should normally be far below that.
For two common follow-ups, see how to check which image gets priority for LCP and the LiteSpeed Cache settings this site uses on Hostinger.
Summary
A slow WordPress site is either slow to respond or heavy to render. Measure TTFB first: high server time points to caching, plugins, database and hosting, while a quick response with a slow page points to images, CSS, JavaScript, fonts and third-party scripts. Change one thing at a time and measure again so you know what actually helped.